Extensional fault-bend folding: Implications for localized fracturing
Introduction
This material is of direct interest to people working on: fault seal; reservoir compartmentalization or communication by sealing or leaking faults; any problem in reservoirs with permeable fractures, from wildcatting through reservoir simulation and secondary recovery; any geological problem in extended terranes; reservoir modeling.
This section covers: the process of folding at bends of extensional (normal) faults; how this type of folding produces extensional strain; how the strain magnitude can be calculated directly from seismic data; how the strain magnitude is a predictor of fracture strain.
The discussion is based on a conceptual model of extensional fault-bend folding described in: H. Xiao & J. Suppe (1991) The origin of rollover: AAPG Bulletin, v. 76, no. 4, p. 509–529.
Flattening bend: Initial state
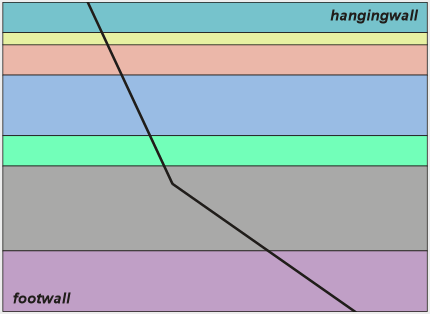
When faults form, they often develop bends, or changes in orientation. This diagram shows an example of a normal fault with a flattening bend prior to the development of significant displacement along the fault.
Figure 1. Normal fault with a flattening bend — initial state.
Solving the room problem by void formation
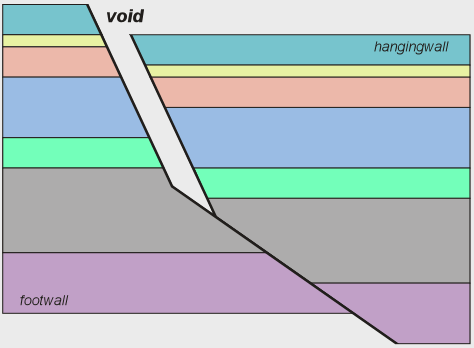
If rocks were sufficiently strong, then continued fault movement would open a void.
Figure 2. Void formation at a flattening bend.
Solving the room problem by folding
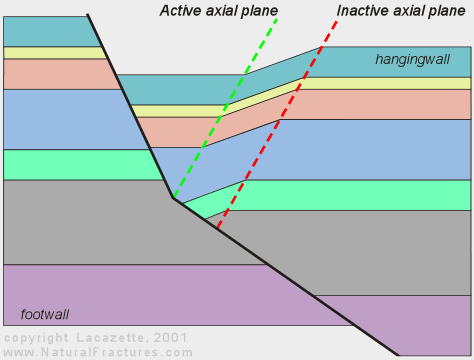
In the earth, rocks must deform to fill the void as the hangingwall block moves past the fault bend. Key points: the inactive axial plane moves with the hangingwall block; the active axial plane is pinned to the fault bend and remains stationary relative to the footwall block; the rocks fold continuously as they move through the active axial plane.
Figure 3. Folding process at a flattening bend.
The Coulomb shear model
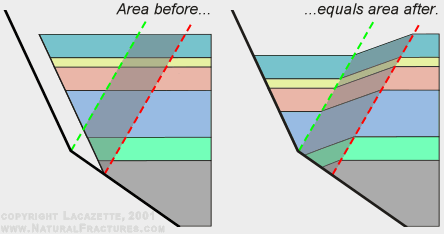
In the Coulomb shear model, extension is accomplished by Coulomb shear (bulk frictional slip, like in a pile of sand) — NOT by flexural-slip of bedding. The dip-angle of the fold axial planes is equal to the Coulomb shear-angle of the deformed rocks. Material conservation requires that the cross-sectional area of the extended fold panel remains constant in 2D models.
Figure 4. Area conservation in the Coulomb shear model.
Quantitative relationships
The Coulomb shear model provides a quantitative relationship between fold shape and fault shape. This equation relating fold shape to fault shape is applicable under general conditions.
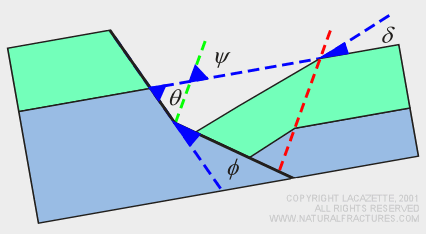

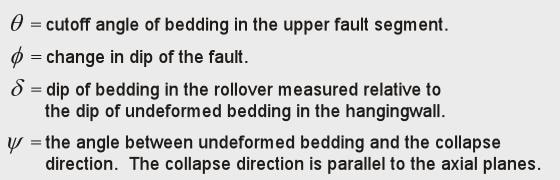
Figure 5. Geometric diagram and equation for the Coulomb shear model.
Folding requires extensional strain
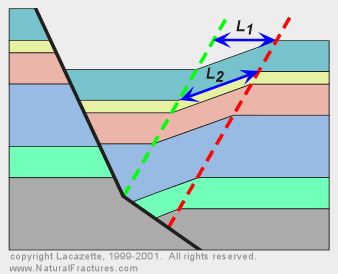
Stratigraphic length L1 must extend to length L2 in the folded panel. The Coulomb shear model makes specific, quantitative predictions about rock strain. Good quality seismic data often resolves the fault and bedding orientations well enough to predict the amount of strain in the folded panel. Regardless of whether or not strain can be computed from seismic data, fold panels of this type must be areas of extensional strain.
Figure 6. Extensional strain in the folded panel.
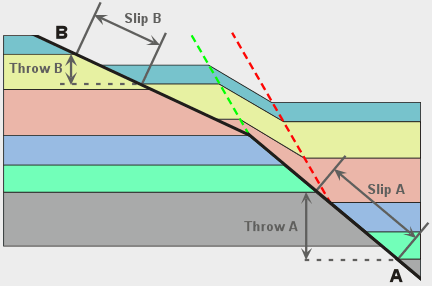
Slip and throw change across the fault bend
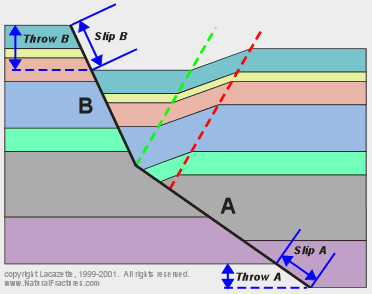
The Coulomb shear model makes specific, quantitative predictions about relative slip magnitudes/rates, and subsidence amounts/rates for each fault segment. In a typical example, the slip on segment B is 15% greater than the slip on segment A and stratigraphic throw across segment B is 88% greater than across segment A.
Figure 7. Slip and throw changes across a flattening bend.
Qualitative predictions
If folding-related strain is accommodated by brittle fracturing, then we can predict where fractures are developed with simple structural models.
Figure 8. Qualitative fracture predictions from structural models.
Example: Outcrop-scale void filling and folding, Eastern Utah, U.S.A.
Figure 9 shows the hangingwall block of an extensional fault-bend fold above a flattening bend. The passive limb is weakly jointed. The relatively short extended limb is cut by normal faults and some joints. The homogeneous mass on the far right is a mud diapir that prevented collapse and folding of the hangingwall by intruding the void as it developed.
Figure 9. Outcrop-scale void filling, Eastern Utah.
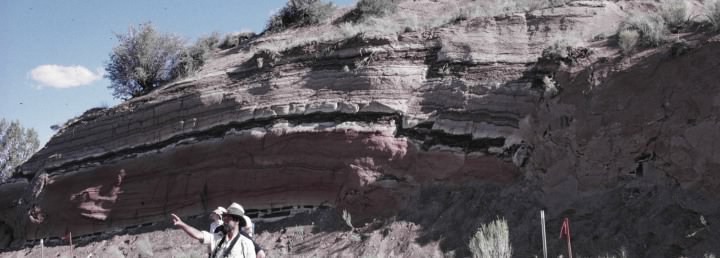
Example: Outcrop-scale folding, Eastern Utah, U.S.A.
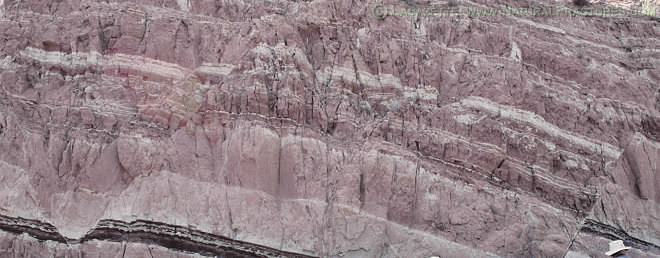
Extensional fault-bend folding due to a flattening bend in a normal fault. Few fractures are present in the footwall block and to the left of the axial plane that divides the passive limb from the extended limb. The extended fold panel is heavily fractured — extensional strain was accommodated by both normal faulting and jointing.
Figure 10a. Overview of extensional fault-bend fold, Eastern Utah.

Figure 10b. Heavily fractured rock in the extended limb.
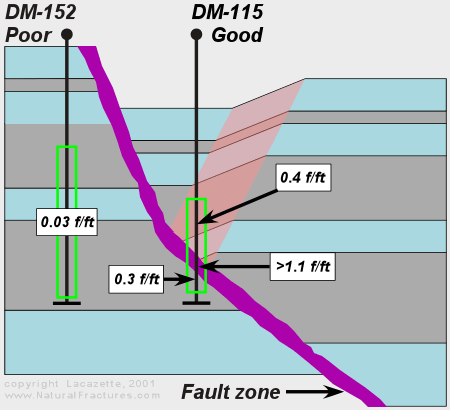
Example: Mara Field, Venezuela
Schematic cross-section of a late extensional fault on the flank of the main anticline showing the relative structural positions of two wells. Fracture density (fracture surface area/unit volume) was calculated from fracture data measured in image logs. The computed fracture densities demonstrate the relationship between fracturing and extensional folding. Fracture density is clearly correlated with production.
Figure 11. Mara Field, Venezuela — fracture density vs. structural position.
Steepening bends: Initial state
Faults also develop steepening bends. Deformation at a steepening bend can be treated with the same Coulomb shear model and equations previously discussed for flattening bends.
Figure 12. Steepening bend — initial state.
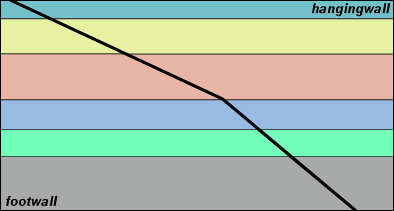
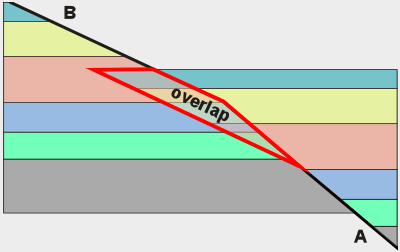
The room problem
In this case slip along segment A appears to require the hangingwall block above segment B to penetrate the footwall block, which is impossible if material is conserved.
Figure 13. The room problem at a steepening bend.
Solving the room problem: Extension or shortening?
Both extension (Figure 14) and shortening (Figure 15) are geometrically acceptable solutions to the room problem. However, only extensional folding is compatible with extensional stress because shortening requires the wrong shear-sense at the active axial plane.
Folding of the type depicted in Figure 15 indicates wrench faulting and/or polyphase deformation.
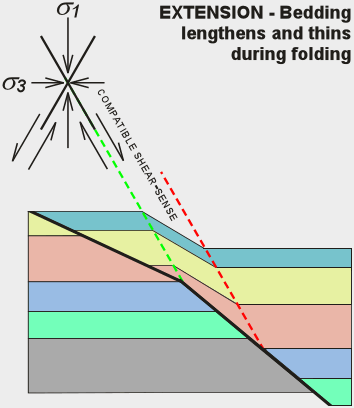
Figure 14. Extension solution to the room problem at a steepening bend.
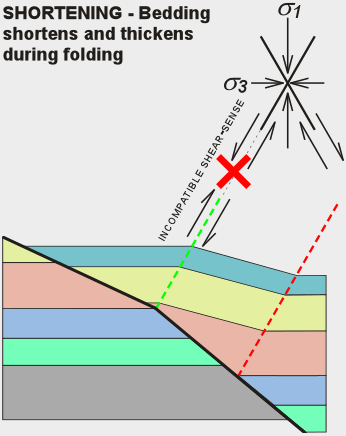
Figure 15. Shortening solution to the room problem at a steepening bend.
Slip and throw change across a steepening bend
As in the case of a flattening bend, the Coulomb shear model makes specific, quantitative predictions about relative slip magnitudes/rates, and subsidence amounts/rates for each fault segment. Again, both fault slip and stratigraphic throw change across the fault bend. In this example, the slip on segment B is 68% of the slip on segment A and stratigraphic throw across segment B is 45% of that across segment A. During fault movement, the slip rate is correspondingly slower on segment B as is the subsidence rate above segment B. Again, the variations in slip rate/amount may be an important control on the size and damage intensity of the fault damage zone.
Steepening and flattening bends may appear to be simple geometric opposites of each other, but there is a critical difference: at a steepening bend the friction on the upper fault segment is higher than on the lower fault segment, but the reverse is true on a flattening bend. Because of this difference, the hangingwall above a steepening bend tends to detach causing the fault to steepen or straighten, but the hangingwall above a flattening bend tends to move with the rest of the block and undergo extensional folding as it collapses to fill the void.
Figure 16. Slip and throw changes across a steepening bend.
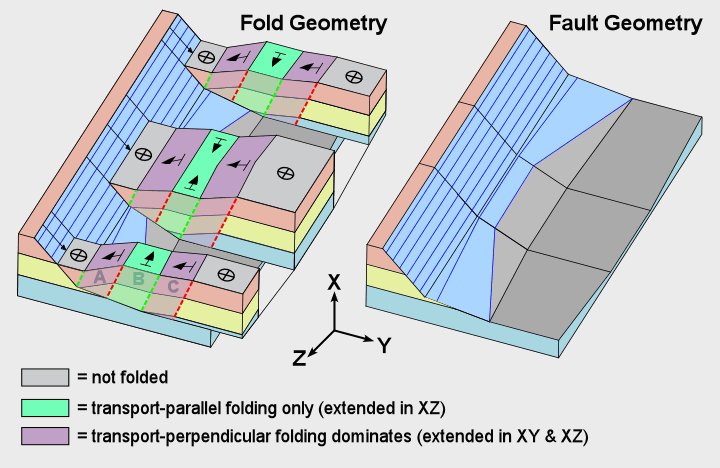
Multiple fault bends and 3-dimensional folding
The hangingwall of a fault with multiple bends can experience multiple distinct episodes of deformation in a single continuous deformation. Quantitative structural analysis can divide geologic structures into domains with homogeneous deformational histories. Quantitative fracture data at one location in a domain can be extrapolated throughout the domain, so that a fracture model for an entire field can be estimated in three dimensions.
Figure 17. Multiple fault bends and 3D structural domains.
Example: Arches National Monument, Utah, U.S.A.
This example shows extensional fault-bend folding parallel and perpendicular to the transport direction above both flattening and steepening bends in a thick sandstone formation. The red shale that overlies the sandstone has been eroded off but the sandstone has hardly eroded at all so that we can see the complete 3-D shape of the structure. Fracture cognoscenti who are my contemporaries (who are probably retired now, unlike me) will recognize this as one of Marco Antonellini's PhD field areas, but this crude interpretation is my own so please don't blame Marco for it.
Figure 18. Extensional fault-bend folding, Arches National Monument, Utah.
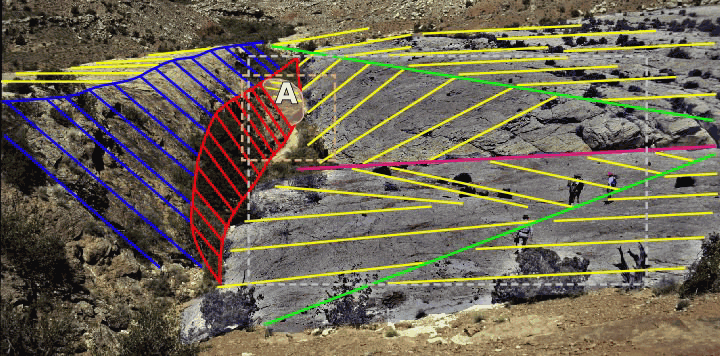
Annotation key for Figure 18:
- Green lines: Fold hinges.
- Magenta line: Trace of a tear fault.
- Yellow: Dip on the surface of the sandstone layer.
- Blue: Dip on shallow parts of the fault surface.
- Red: Dip on a steep patch of the fault.
Remnant (A) of the hangingwall is above the steep fault patch. Note that bedding in the block dips shallowly to the right unlike bedding in the footwall and in the passive (non-extended) domain in the hangingwall.
The sandstone surface to the right of the fault was digitally enhanced to make fractures more visible.
Notice that:
- The stream valley at the base of the fault outcrop is wide in the vicinity of the steep patch.
- Vertical, roughly fault-parallel fractures predominate in the valley walls.
If you have read this entire page, then you should be able to explain, or at least speculate about:
- The shape and dip-directions of the left-dipping fold limbs, their geometric relationship to the tear fault, the orientation of the tear fault, and why the fault is centered on the steep patch.
- Do these features tell us about the shape of the fault below the ground surface?
- Is there another fault bend underground? What kind?
- Could you determine the depth and angle of the bend if you had quantitative data for this structure?
- What happens to the bend along the strike of the fault? Is this reflected in the shape of the fold in the hangingwall?
- The orientations of fractures in the hangingwall block.
- What happened to the rest of the rocks in this hangingwall domain and why did it happen?
- Why didn't the hangingwall fragment (A in Figure 18) suffer the same fate as the rest of the rocks in its domain?
- Does your answer to the previous question indicate a way to improve the interpretation sketched on Figure 18? Look at the detailed photos. Did I make a mistake with the annotation in Figure 18?
Comparing the dip-angles, dip-directions and elevations of the top of the sandstone in the footwall and in the passive (non-extended) fold limb in the hangingwall indicates that there wasn't much slip on the fault and that a relatively unfolded, flat-dipping structural domain should be present where the valley is. The surface of the hangingwall fragment (A in Figure 18) is continuous with the surface of the extended limb and appears to represent a piece of the rock from this domain.
End of section 1.3.2. Continue to page 1.3.3: Fracturing during contractional fault-bend folding.