Contractional fault-bend folding:
Implications for localized fracturing
Introduction | |
|
Background. This section assumes that you have read the introduction to Section 1.3 and are familiar with: Structural model. The discussion in this section is based on a conceptual model of fault-bend folding described in: J. Suppe, 1983, Geometry and kinematics of fault-bend folding: American Journal of Science, v. 283, p. 684-721 V. S. Mount; J. Suppe; S.C. Hook, 1990, A forward modeling strategy for balancing cross-sections: Bulletin of the American Association of Petroleum Geologists, v. 74, no. 5 (May), p. 521-531. However, the general concepts of structural domains and structurally-controlled fracturing are independent of any structural model. Constraints and assumptions of the model.
|
CONTENTS
| Initial state | |
|
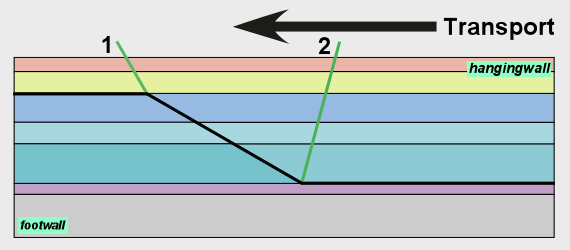
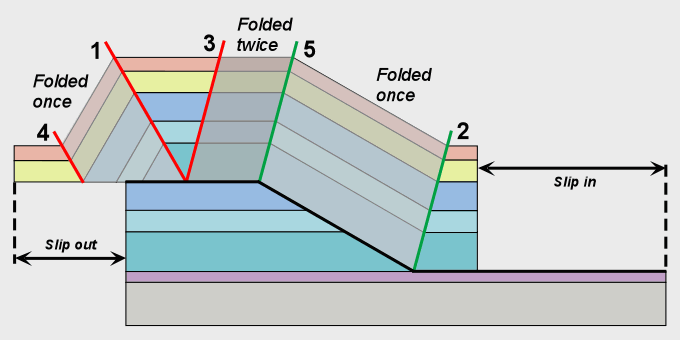
Thrust faults typically run parallel to bedding in weak horizons (such as shales) and then ramp steeply through competent stratigraphic packages (such as carbonates) until they encounter another weak horizon, as shown in this figure. Folding begins at the active axial planes (green) as soon as the hangingwall block begins moving. |
|
Folding at the base of the ramp is easy to visualize.
|
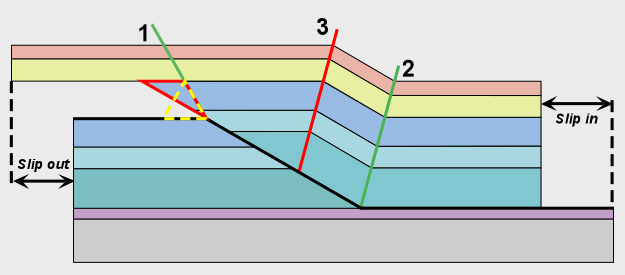
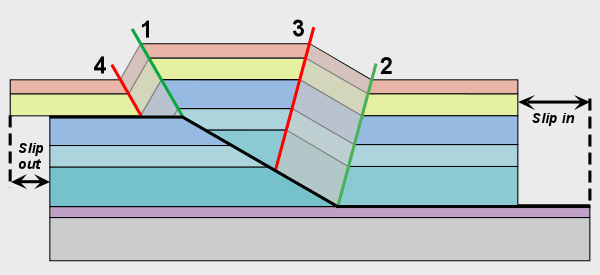
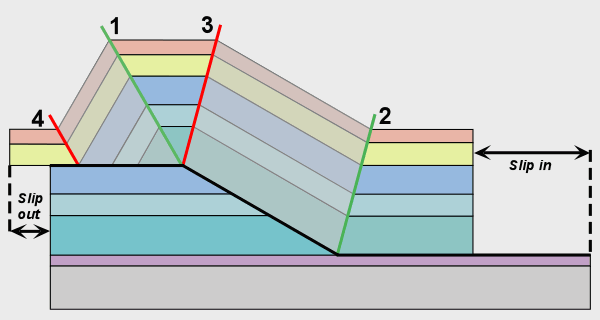
The folding process at the top of the ramp is less obvious.
Clearly, strata above the ramp cut-off do not fold as long as they are above the ramp.
|
CONTENTS
|
CONTENTS
|
CONTENTS
|
CONTENTS
|
These concepts have several implications for reservoir geology:
|
|
CONTENTS
2D Example: Fault-bend fold in outcrop, Neuquen Basin, Argentina |
|
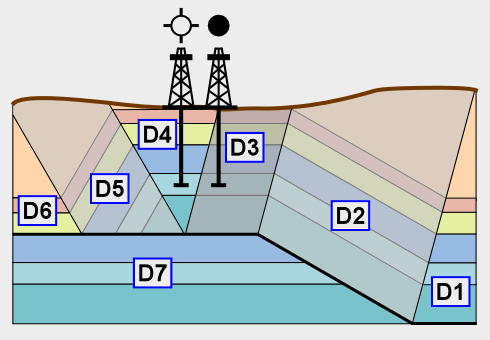
| Photograph showing the forelimb of a fault-bend fold in an outcrop of limestones and shales. The fold is in the early stages of anticlinal growth (compare with Figure 3). Fractures are much more abundant in the folded panel (D7 in Figure 6). The fault began as a sharp break forming a planar ramp and flat joined at a sharp corner as illustrated in Figures 1 through 7. The corner broke off and the fault progressively developed a damage zone with continued slip. The complex fault zone shape and several minor faults produced additional fractured and folded panels in the hangingwall block that are visible in an unannotated, detailed (340kb) version of this photo. |
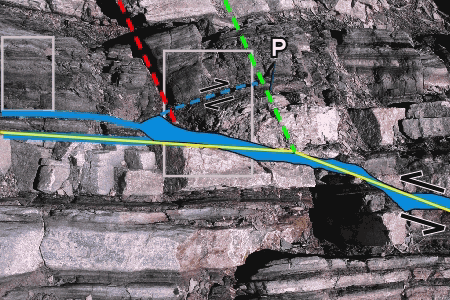
| P: Pen for scale. Solid yellow line: Original trace of fault. Dashed green line: Active axial plane. Dashed red line: Inactive axial plane. Solid blue: Fault zone and fault strands. Dashed blue line: Minor backthrust. Half-arrows show the sense of motion across the faults. Click in the rectangles to bring up detailed photos of these areas in a new browser window (Left-23kb, Center-109kb). Left-hand rectangle: Slightly fractured rocks in the never-folded but transported domains above the upper bedding-parallel fault segment (domain D6 in Figure 6). Right-hand rectangle: Heavily fractured rocks in the once-folded domain above the fault (domain D7 in Figure 6) and almost unfractured rocks in the never folded or transported domain below the fault (domain D5 in Figure 6). |
CONTENTS
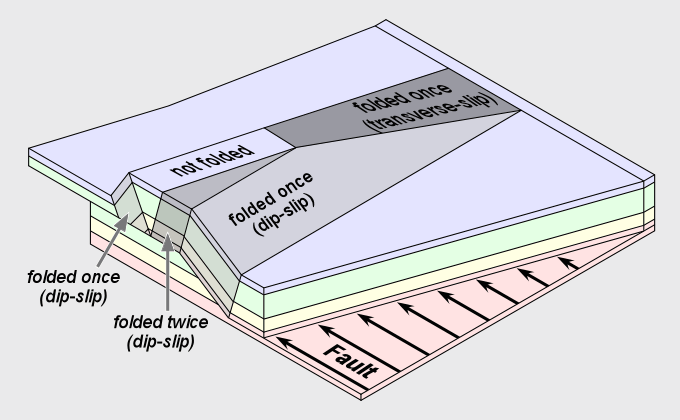
| Figure 7 is a three-dimensional view of a fault-bend fold anticline. The plunging nose of the anticline results from decreasing displacement along the fault. |
|
CONTENTS
|
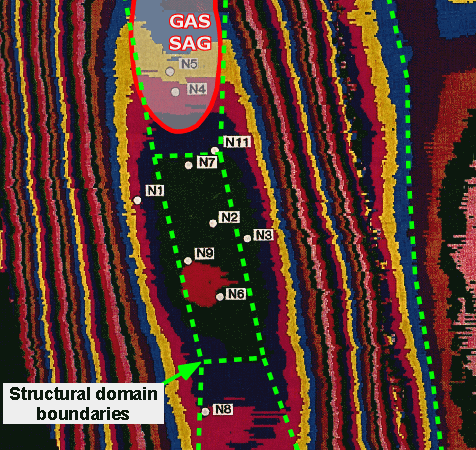
Time slice from 3D seismic survey across Nan Yi Shan field showing localization of
gas sag on the northern plunge-panel of the fold. The best production test results
from the fractured reservoir were from wells in the gas sag zone. Wells on
the structurally higher fold crest had poorer tests. This suggests that localized
fracturing in the plunge panel domain improved reservoir porosity and
permeability. The fractures probably formed by stretching of the plunging nose. Figure 9. After: R.J. Paul, 1993, Seismic detection of overpressuring and fracturing. An example from the Qaidam Basin, People's Republic of China, Geophysics, v.58, no. 10, p. 1532-1543. |
CONTENTS
Copyright © 2000 - 2017 • Alfred Lacazette • All Rights Reserved